
Similarities & differences between RSI & Stochastics as trading signals

ForexTrading got the question from a woman about that mainly use Stochastics as a trading signal: “What would you say is the biggest difference between RSI and Stochastic?
A very good question – especially if, like most of us, you don’t want to dig directly into the formulas to draw conclusions (although the formulas for both are at the bottom of this article).
Therefore, we will first give you a brief summary about RSI and the main similarities & differences versus Stochastics, while also elaborating when each of them can be used.
By the way, ForexTrading.uk also wants to recommend reading more about Bollinger Bands as an alternative to seeing a trading range.
For people who only use one type of price torque oscillator , which is a type of technical indicator that measures movement or signal variations to find buy or sell positions that vary around an equilibrium position, you should realize the following:
+ Both RSI and Stochastic measure price movements, but in different ways and they are suitable for different markets.
+ A stochastic oscillator is based on the assumption that closing prices should close in the same direction as the current trend.
+ RSI is more useful when the instrument is trending (going up or down).
+ Both RSI and Stochastics give clear signals when running daily graphs, where each movement on the chart is 1 day. For shorter periods, these signals are not always so relevant.
+ The stochastic indicator, on the other hand, is more useful when the market goes sideways or is a bit choppy – without a clear trend.
+ Always keep an eye on the market’s daily direction, in a slightly longer perspective, when choosing which price momentum indicator can best suit.
Technical indicators to predict market developments
Today we go through two of the most well-known indicators in technical analysis, which are often used as a buy or sell signal in trading. For RSI, the 30 level on daily graphs is often set as the limit for oversold, which indicates that it is time to buy the stock, the commodity or the currency pair. If the RSI shows above 70, then it can be a common way to go in and shine with CFDs. Hang on and learn how Stochastics works and if it can be an alternative to RSI – and learn how both work. In the end, all you need is a trading site like Skilling to get started and test which of the technical indicators do you prefer.
Relative strength index (RSI) and stochastic oscillator are both price moment oscillators used to predict market developments. Despite their similar goals, the two indicators have very different underlying theories and methods. The stochastic oscillator is based on the assumption that closing prices should close in the same direction as the current trend . Markus with us at Valutahandel, believes that this can be a bit single-track, although in markets that go sideways it may be appropriate, provided you use daily graphs.
RSI tracks overbought and oversold levels by measuring the speed of price movements . More analysts use RSI over the stochastic oscillator, but both are well-known and reputable technical indicators, which fit in different market conditions.
Table of Contents: Overview
- 1 Relative strength index (RSI)
- 2 An RSI example from reality: Halliburton
- 3 Stochastic Oscillators
- 4 Similarities between RSI and Stochastics
- 5 What is the difference between Stochastics and 14 day RSI?
- 6 What is used by analysts the most?
- 7 What does the formula look like for RSI??
- 8 What is the formula for Stochastics?
Relative strength index (RSI)
J. Welles Wilder Jr. developed relative strength indices by comparing the most recent gains in a market with the most recent losses. In this way, the RSI is a momentum indicator that measures the size of recent price changes to evaluate overbought or oversold terms in the price of a stock or other asset.
 Click for a larger image where you can see the buy and sell signals more clearly[/ caption]
The RSI is usually displayed as an oscillator (a line chart moving between two extremes) at the bottom of a chart and can have a reading from 0 to 100. The midpoint of the line is 50. When the RSI moves above 70, the underlying asset is considered overbought. Conversely, the asset is considered oversold when the RSI reads below 30. Traders also use the RSI to identify areas of support and resistance, detect deviations for any return, and to confirm the signals from other indicators. You can read more in-depth about RSI here (coming soon).
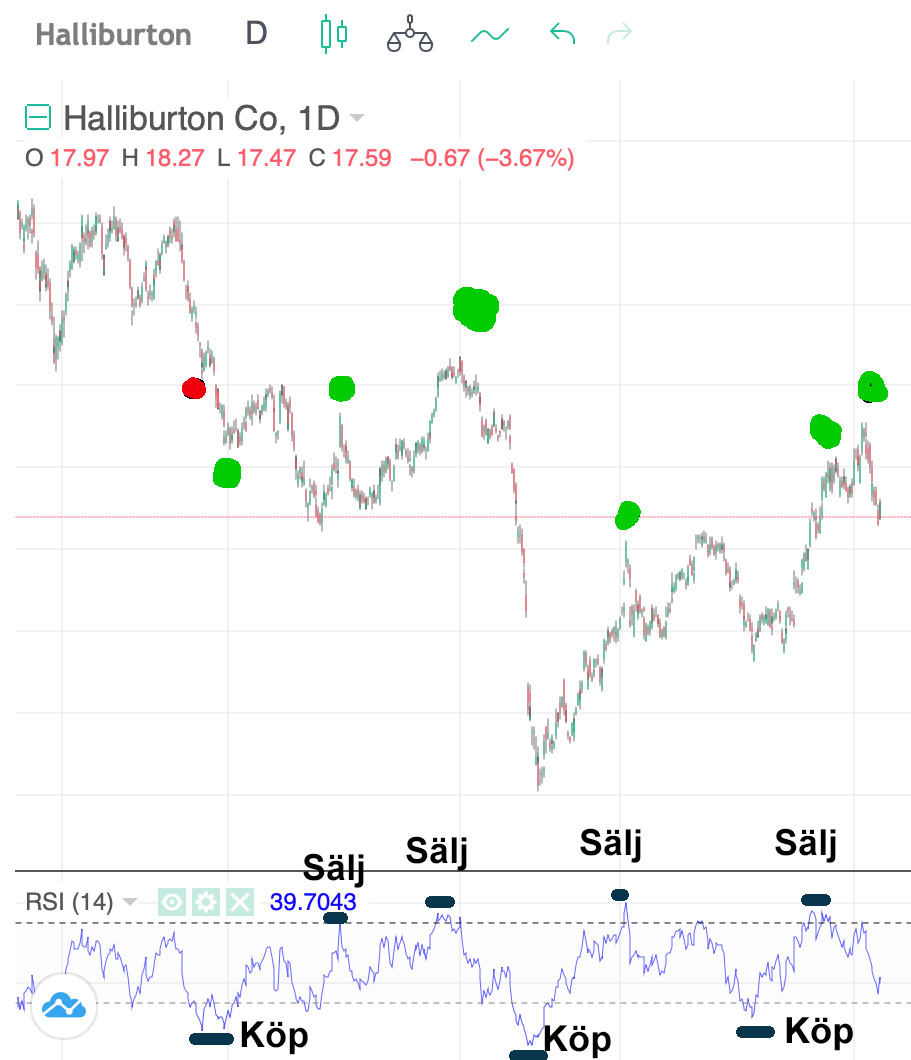
An RSI example from reality: Halliburton
In the chart that is set to show the daily price, you can see that 7 trading signals for RSI have emerged in the last two years, provided that you use 30 as a buy signal and 70 as a sell signal. Out of these, the development has become significantly positive in 6 out of 7 cases . For the positive cases, you see a green dot in the chart, while a red dot appears when it has not given a significant gain in a few weeks’ time. As you may notice, Halliburton may soon be about to give a buy signal again, which may be fun to study if you want to examine how well RSI works on a cyclical stock, which often follows slightly more long-term trends. The graph to the right is taken from Skilling , where you can shop Halliburton on a safe and secure platform, with BankID and fast and free registration in just 10 seconds . Try signing up for Skilling now !
Risk warning : These are not trading tips or advice from ForexTrading.uk, we just try to clearly describe how RSI works, with a concrete example. Different settings, varied instruments and the trend for availability can vary how well it works. It is normal for people to use RSI for stocks, currencies and commodities on a daily basis, which are not in a sideways movement, but which are trending up or down.
Stochastic Oscillators
George Lane created stochastic oscillators that compare the closing price of a security with a range of its prices over a period of time. Lane believed that prices tend to close near their peaks in rising markets and close to their declines in falling prices. Like RSI, stochastic values are plotted in the range between 0 and 100. Overbought conditions exist when the oscillator is above 80, assets are considered oversold when the values are below 20.
Stochastic oscillator charts generally consist of two lines: one that reflects the actual value of the oscillator for each session and one that reflects its simple three-day moving average. Since price is believed to follow momentum, the intersection of these two lines is considered to be a signal that a turnaround may be underway, as it indicates a large change in momentum from one day to another.
Differences between the stochastic oscillator and trending price measures are also seen as an important reverse signal. For example, when a bearish trend reaches a new lower low, but the oscillator prints a higher low, it may be an indicator that bears are depleting their speed and a bullish reversal is breaking. Similarly, differences between RSI and price are also considered significant.


Rating: 9.67/10
Minimum deposit: 250 GBP
Description: Handla valuta & aktieCFD’er med Capital. En av de mest ansedda sajterna. Allt på svenska, med bra support. Prova nu!
Risk warning: 75.26% of retail investor accounts lose money when trading with Capital.
Similarities between RSI and Stochastics
They seem similar, but StochRSI relies on a different formula than that which generates RSI values.  RSI is a derivative of the price. Meanwhile, StochRSI is a derivative of RSI per se, or a second derivative of price. One of the most important differences is how fast the indicators move. StochRSI moves very quickly from overbought to oversold, or vice versa, while RSI is a much slower moving indicator. One is no better than the other, StochRSI just moves more (and faster) than RSI.
A disadvantage of using StochRSI is that it tends to be quite volatile and quickly goes from high to low. Equalization of StochRSI can help in this regard. Some traders take a moving average of StochRSI to reduce volatility and make the indicator more useful. For example, a 10-day simple moving average of StochRSI can produce an indicator that is much softer and more stable. Most charting platforms make it possible to apply one type of indicator to another without any personal calculations.
StochRSI is also the second derivative of the price. In other words, its output is two steps from the actual price of the asset being analyzed, which sometimes means that it can be out of sync with an asset’s market price in real time.
What is the difference between Stochastics and 14 day RSI?
Stochastics follows the trend and expects the trend to go in the same direction all the time. RSI measures overbought or oversold, by measuring speed / pace.
Both Relative Strength Index (RSI) and Stochastic Oscillator are price moment oscillators used to predict market developments. Despite their similar goals, they have very different underlying theories and methods. The stochastic oscillator is based on the assumption that closing prices should close in the same direction as the current trend. RSI tracks overbought and oversold levels by measuring the speed of price movements. More analysts use RSI over the stochastic oscillator, but both are well-known and reputable technical indicators.
J. Welles Wilder Jr. developed RSI by comparing the most recent gains in a market with the most recent losses. RSI values range from 0 to 100 and are plotted on a line below the price chart. The midpoint of the line is 50. When the RSI value develops above 70, the underlying asset is considered to be overbought. Conversely, the asset is considered oversold when the RSI reads below 30. Traders also use the RSI to identify areas of support and resistance, detect deviations for any reversals, and confirm the signals from other indicators.
Stochastic oscillators were created by George Lane. Lane believed that prices tend to close near their peaks in rising markets and close to their lows in declining markets. Like RSI, stochastic values are plotted in a range delimited between 0 and 100. Purchase conditions exist when the oscillator is above 80 and the asset is considered oversold when values are below 20. Stochastics actually uses two lines (known as K and D lines) and a crossover analysis can be performed based on the ratio of each of them.
In general, RSI is more useful in trend markets and stochastics are more useful in sideways or choppy markets. The RSI was designed to measure the speed of price movements, while the stochastic oscillator formula works best in consistent trading intervals.
What is used by analysts the most?
More analysts use RSI over the stochastic oscillator, but both are well-known and reputable technical indicators.


Rating: 9.78/10
Minimum deposit: 50 GBP
Description: Get inspiration in your trading with eToro’s copytrading. You can adjust the leverage level between 1-30x for currency and 1-5x for stock CFDs, which no other online trading site offers. Try eToro now!!
Risk warning: 68% of private investors lose money when they trade CFDs with eToro.
What does the formula look like for RSI??
Relative Strength Index (RSI) is calculated with a two-part calculation starting with the following formula:
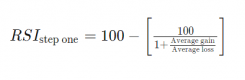
The average gain or loss used in the calculation is the average percentage gain or loss over a review period. The formula uses a positive value for the average loss.
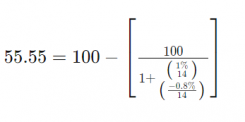
The standard is to use 14 periods to calculate the initial RSI value. For example, imagine that the market closed higher seven of the last 14 days with an average profit of 1%. The remaining seven days all closed lower with an average loss of -0.8%. The calculation for the first tranche of the RSI would look like the following extended calculation:
When there are 14 periods available, the second part of the RSI formula can be calculated. The second step in the calculation evens out the results.
![]()
Using the formulas above, the RSI can be calculated, where the RSI line can then be plotted under an asset’s price chart.
The RSI will increase as the number and size of positive closures increases, and it will decrease as the number and size of losses increase. The second part of the calculation releases the result, so the RSI only comes close to 100 or 0 in a strongly trending market.
What is the formula for Stochastics?
The formula for the stochastic oscillator is:
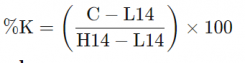
Where:
C = the latest closing price
L14 = The lowest price traded by the 14 previous trading sessions
H14 = The highest price traded during the same 14-day period
% K = The current value of the stochastic indicator
In particular,% K is sometimes referred to as the fast stochastic indicator. The “slow” stochastic indicator is taken as the% D = 3 period moving average of% K.
The general theory underlying this indicator is that in a market that is moving upwards, prices will close close to the high, and in a market that is trending downwards, prices will be close to the low. Transaction signals are created when% K passes through a three-period moving average, called% D.
The difference between the slow and fast stochastic oscillator is that the slow% K contains a% K slowdown period of 3 which controls the internal equalization of% K. If you set the equalization period to 1, you are equivalent to planning the fast stochastic oscillator.
The best forex broker , with the best platform. Can it get better? Get started with MetaTrader 4 on Skilling now !
Published:
Author: Erik Forsell
TAGGAR
Other similar news
Below you can see more similar news if you want to learn more about this subject or find related topics.Everybody knows there's a war going on in Ukraine, Russia is trying to take over the country and the...
Recently we've seen headlines all across the globe shouting about how Russia is preparing to invade ...
It's been roughly 2 years since the start of the Corona pandemic, one of the biggest events in moder...
